Pick a layer to read it, or jump to its section.
Client-side applications, the Logidot Cloud, the physical hardware and the WMS / ERP

Unsere Technologie
Um die digitale Transformation Ihres Betriebs zu ermöglichen, müssen Sie den genauen Standort und Status der relevanten Assets in der Werkstatt kennen. Darüber hinaus müssen Sie diese in Echtzeit verbinden und mit Rechenleistung erweitern, damit sie so schnell und intelligent wie möglich interagieren. Logidot hilft Ihnen dabei, dies durch drei Kerntechnologien zu erreichen: RTLS, IOT-Plattform und Simulator.
Pick a layer to read it, or jump to its section.
Client-side applications, the Logidot Cloud, the physical hardware and the WMS / ERP
RTLS
Logidot kombiniert eine Handvoll Technologien, um Assets mit branchenführender Genauigkeit zuverlässig zu verfolgen.
Ultra-Breitband (UWB) ist ein drahtloses Kommunikationsprotokoll mit kurzer Reichweite - wie Wi-Fi oder Bluetooth, das Funkwellen mit kurzen Impulsen über ein Frequenzspektrum von 3,1 bis 10,5 GHz verwendet. Seine einzigartige Kombination von Signaleigenschaften - eine feine Zeitauflösung sowie Robustheit gegen Störungen und Reflexionen - macht es zu einer sicheren, zuverlässigen und genauen Wahl für die Nachverfolgung von Assets.
Finde mehr heraus.Mit den neuesten GPS-Chips können wir Assets im Freien mit Submeter-Genauigkeit und in einigen Fällen auch in Innenräumen zuverlässig verfolgen, indem wir Signale von mehreren Satelliten kombinieren.
IMUs können Kräfte, Winkelraten und Orientierung mit einer Kombination aus Beschleunigungsmessern und Gyroskopen messen. Es ermöglicht eine genaue Standortverfolgung über kurze Flugbahnen, wenn Okklusionen auftreten oder das GPS- oder UWB-Signal verloren geht.
Ein Barcode, der aus Strichen und Zwischenräumen besteht, ist eine maschinenlesbare Darstellung von Ziffern und Zeichen. Streifen wie die unten abgebildeten sind heute auf den Verpackungen von Produkten in Supermärkten, Convenience-Stores und anderen Geschäften allgegenwärtig.
Nutzt elektromagnetische Felder, um an Objekten angebrachte Tags automatisch zu identifizieren und zu verfolgen. Ein RFID-System besteht aus einem winzigen Funktransponder sowie einem Funkempfänger und -sender. Wird das Tag durch einen elektromagnetischen Abfrageimpuls eines nahegelegenen RFID-Lesegeräts ausgelöst, sendet es digitale Daten — in der Regel eine Bestandsnummer zur Identifizierung — an das Lesegerät zurück.
Durch die Kombination der Daten mehrerer physikalischer Sensoren über Fusionsalgorithmen kann eine genaue und robuste Verfolgungsleistung erzielt werden.
UWB, GPS, IMU, RFID, QR and sensor fusion on one floor; TWR and TDoA
The floor itself
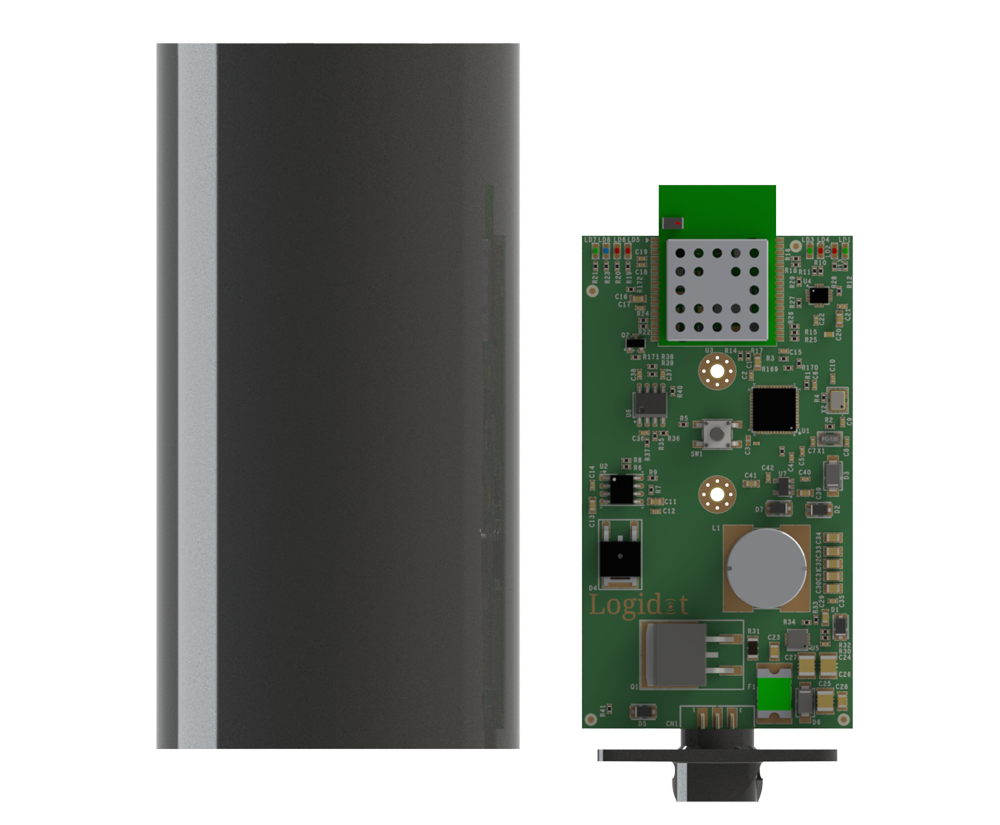
Fixed sensor-set that provide location to moving targets, include UWB sensor. Can use the embeeded battery for months of life-cycle or be connected to your power maze.
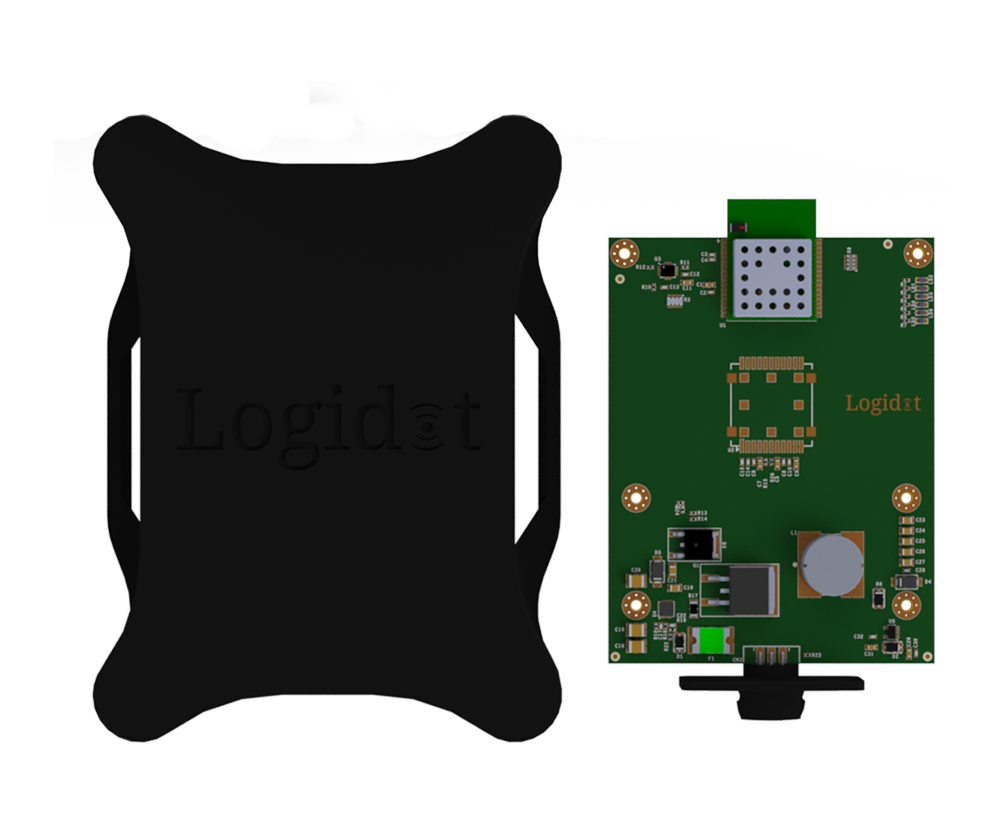
Interfaces with our gateway, integrates UWB, a 6-axis IMU (accelerometer and gyroscope) and GPS. Battery life of one week with the option to be attached directly to the vehicle power source.
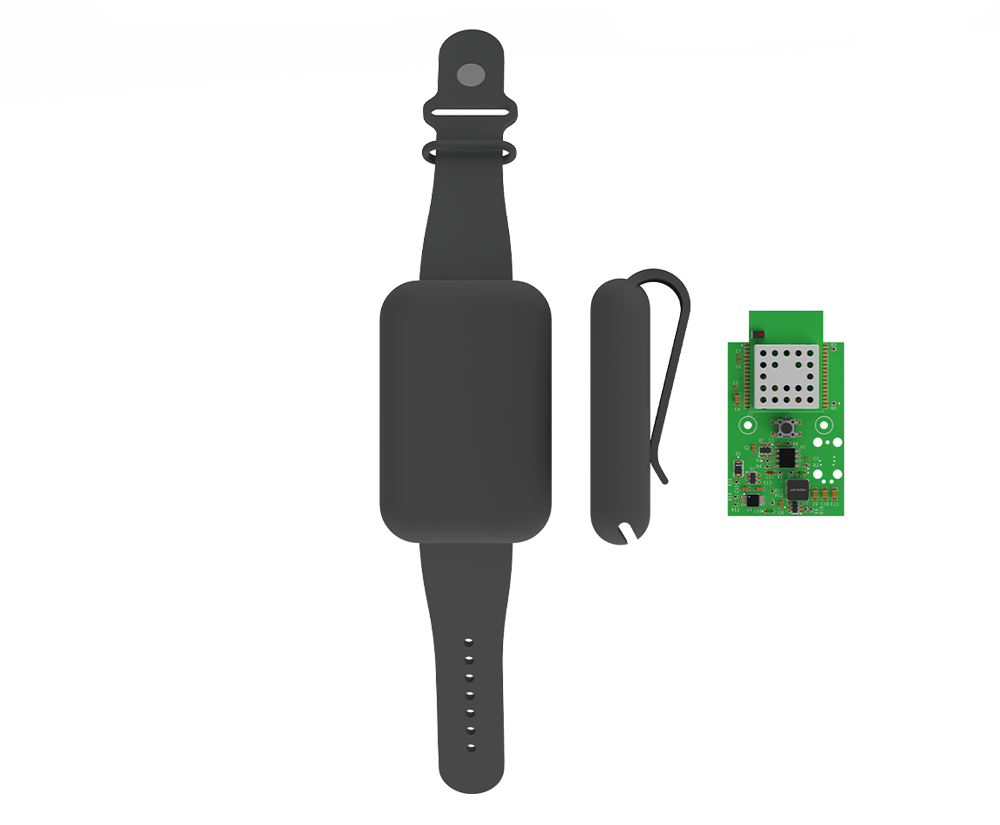
Interfaces with our gateway, integrates UWB and a 3-axis accelerometer. Battery life of one day.
The layer the other two stand on: tags on the vehicles and the people, anchors on the racking, a gateway off the floor. What they measure leaves the building once and arrives in the cloud as position, identity and status.
Datenblatt
Anchor, vehicle tag, wearable tag, and the four data sheets
Unsere Echtzeit-IOT-Plattform liefert Standort-, ID- und Statusdaten für verschiedene Assets und führt zu messbaren Prozessen. Die Plattform ermöglicht es daher, Prozesse in Produktion und Logistik zu überwachen, zu optimieren und zu automatisieren. Die offene und hochelastische Architektur ermöglicht eine einfache Integration und einen schnellen ROI.
Anchors are the building’s reference points. Screwed, magneted or strapped to racking, columns and walls, each one ranges every tag in view over UWB — months on the internal battery, or wired into site power.
The gateway is the one box between the floor and the platform: it collects what the anchors hear and forwards it over whatever the site already has — Ethernet, Wi-Fi or a mobile connection.
A wearable tag puts the people on the floor on the same live map as the vehicles — UWB for position and a 3-axis accelerometer for what they are doing. A day on a charge, and nothing to operate.
Forklifts, pallet trucks and tugs carry a vehicle tag. UWB indoors, a 6-axis IMU for motion and GPS when the work goes outside — a week on battery, or taken straight off the vehicle’s own power.
Every position lands against your own floor plan, so the dashboard shows zones, dwell and routes rather than dots — live within seconds, analysed within minutes, and available through the API to the WMS, ERP or MES you already run.
The architecture is open at the edge too. Sensors you already have — presence, environment, gates, scanners — stream in beside Logidot’s own, so one platform carries the whole picture.
Where the work is done
Hosted for you, so there is nothing to install or keep running on site. Analytic services turn tracks into measures, the intelligence layer reads those measures against how the operation is meant to run, the reporting tools assemble what comes out, the dashboard support services serve the live view, and storage keeps the history — backed up daily and encrypted end to end.
Logidot Cloud, taken apart
The system of record you already run
The warehouse management system stays where it is. Logidot exchanges data with it in both directions — plugins for the most common providers, or an integration built for yours — so real-time position can retire the manual, error-prone steps around it instead of adding another screen.
The operation, run forward
The same data drives a model of your floor you can run forward: layouts, resource allocation, picking strategies and stock placement tried against a shift before anything moves in the building.
Positions become measures
Where tracks turn into the numbers an operation is run on: time by zone, travelled time against order fulfilment, spaghetti maps, utilisation and productivity. Analysed within five minutes of the movement itself.
Measures become judgements
What the analytics measure is read against how the operation is meant to run, so that a busy hour can be told from an unusual one and a pattern worth acting on from noise. It is what turns the numbers below it into the judgements the automation layer acts on — the three together are one pipeline, from position to insight to action.
Supervision, automated
Rules you set watch the live picture for you and flag the anomalies — a vehicle in a restricted zone, an asset that has not moved, a check that was skipped — while the reporting tool sends the regular numbers out without anyone assembling them.
What everything above stands on
The real-time location layer. UWB ranging from the anchors, motion from the tags and GPS where the work goes outdoors, fused into one position per asset against your own floor plan — 3D to 10 cm, up to 16 Hz, on screen within three seconds. Vehicles, goods, maintenance and people all arrive here first.
For the systems
Everything the platform knows is available over REST, so the systems that run the work can read it directly rather than through a person copying numbers between screens.
For the office
The live view and the reports in a browser: wherever you are, sign in and the floor is on screen as it is now, with the history behind it.
For the floor
The same platform in a hand on the floor — checks before a vehicle is used, a log of who used what and when, and the picture where the work is happening rather than back at a desk.
The RTLS platform, the four services on it, the WMS across the top and the three surfaces
Where the operation is read
What your people actually open: the web dashboard with the live map and the charts behind it, the mobile apps on the floor, and the integrations that put the same picture inside the tools they already use.
For the systems
Everything the platform knows is available over REST, so the systems that run the work can read it directly rather than through a person copying numbers between screens.
For the office
The live view and the reports in a browser: wherever you are, sign in and the floor is on screen as it is now, with the history behind it.
For the floor
The same platform in a hand on the floor — checks before a vehicle is used, a log of who used what and when, and the picture where the work is happening rather than back at a desk.
Web dashboard, mobile apps and the REST API
Your data, coming the other way
Orders, stock and master data come the other way, from the systems of record into the platform, so a position on the map is a pallet with an order behind it rather than an anonymous dot.
The system of record you already run
The warehouse management system stays where it is. Logidot exchanges data with it in both directions — plugins for the most common providers, or an integration built for yours — so real-time position can retire the manual, error-prone steps around it instead of adding another screen.
For the systems
Everything the platform knows is available over REST, so the systems that run the work can read it directly rather than through a person copying numbers between screens.
Customer data in, located goods out
Sandbox
Modellieren Sie einen Betrieb, bevor ein einziger Sensor installiert ist. Der Simulator bespielt Ihren eigenen Grundriss mit realistischen Fahrzeug- und Kommissionierbewegungen, und die Plattform behandelt ihn genau wie einen realen Standort im Live-Betrieb — dieselbe Karte, dieselben Warnungen, dieselben Berichte, die Sie am ersten Tag sehen würden.
Sandbox
Der echte läuft auf Ihrem Grundriss, in der Plattform. Dieser hat denselben Arbeitszyklus und dieselben Regler auf einer Beispielfläche — 64 mal 36 Meter, 280 Regalplätze, vier Zonen und eine Flotte, die Sie steuern.
Die Fläche benötigt JavaScript. Die Bedienelemente unten beschreiben, was sie tut.
Klicken Sie auf einen Regalplatz, um diese Position sofort zu bestellen. Klicken Sie auf ein Fahrzeug, um ihm zu folgen.
Flotte
Nachfrage und Handling
| Fahrzeug | Tätigkeit | Aufträge | km | Akku |
|---|---|---|---|---|
| Keine Fahrzeuge auf der Fläche. Fügen Sie eines hinzu, und die Aufträge kommen in Bewegung. | ||||
Gerade passiert
Was dieser hier weglässt
Eine Fläche, eine Schicht, Zuteilung an das nächste freie Fahrzeug und vereinfachte Physik — eine Rechnung, die leicht genug ist, um im Browser mit sechzig Bildern pro Sekunde zu laufen. Der Produktionssimulator plant auf Ihrem eigenen Grundriss, rechnet Schichten und Besetzungen durch und spielt Monate Ihrer Auftragshistorie nach.
A simulated floor: 64 by 36 metres, four zones, a fleet you control
The platform, asked in plain language
The same measures, asked for in words rather than built into a report: which aisles cost the most walking this week, why an alert fired at 04:12, what would change if the fast movers moved bay. The assistant reads what the platform already knows — live position, zone analytics, the rule events, the history — answers with the numbers it used, and hands anything it proposes to the simulator, so a change is tried against a shift before it is made on the floor. It runs beside the platform on servers we host, signed in with the same account as the dashboard.
A question, the data it was answered from, and the change tried before it is made
| Technologie | Richtigkeit | Erreichen | Ort | Anwendung | Daueranker | Dauer-Tag | Infrastrukturkosten | Einfache Bereitstellung/Nutzung |
|---|---|---|---|---|---|---|---|---|
| Wi-Fi |
 <20 m
<20 m
|
 <150 m
|
 2D
2D
|
 Mittel
|
 Mittel
|
Niedrig
|

|

|
| Bluetooth (BLE) |
 <6 m
<6 m
|
 <50 m
<50 m
|
2D
|
 Mittel
|
Mittel
|
Hoch
|

|

|
| RFID/NFC |
 <10 cm
|
 <1cm
<1cm
|
 Stelle
|
Niedrig
|
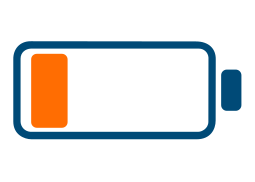 Passiv
|
 Niedrig
|
|
|
| Existing UWB |
 <20 cm
|
<100 m
|
 2D/3D
2D/3D
|
 Niedrig
|
Hoch mit TDoA
|
 Niedrig
|
|
|
| Logidot |
<20 cm
|
<100m
|
2D/3D
|
Hoch
|
Hoch mit TDoA
|
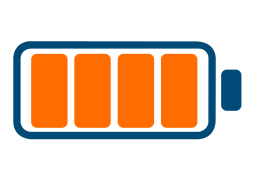
Hoch
|
|
|

Bis zu 10 cm Genauigkeit in 3D und geringe Latenz
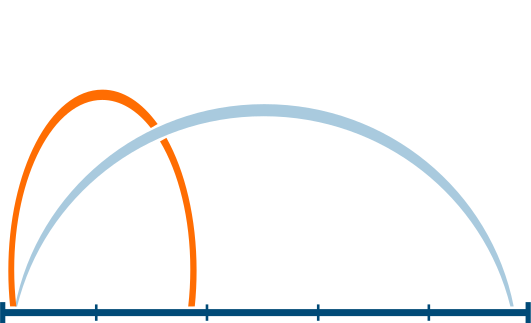
bis zu 16Hz
bis zu 50 m Abstand zwischen den Sensoren

gegen Reflexionen, Geräusche, Vibrationen und Stöße

Fügen Sie einfach weitere Beacons hinzu
kann in wenigen Minuten bereitgestellt werden
Fordern Sie noch heute eine Demo an!
Demo anfordern