Pick a layer to read it, or jump to its section.
Client-side applications, the Logidot Cloud, the physical hardware and the WMS / ERP

Nossa Tecnologia
Para capacitar a transformação digital das suas operações, você precisa saber a localização precisa e o estado dos equipamentos relevantes na fábrica. Além disso, precisa de os ligar em tempo real e aprimorá-los com poder computacional, para que interajam da maneira mais rápida e inteligente possível. Logidot ajuda-o a conseguir isso por meio de três tecnologias core: RTLS, plataforma IOT e simulador.
Pick a layer to read it, or jump to its section.
Client-side applications, the Logidot Cloud, the physical hardware and the WMS / ERP
RTLS
Logidot combina um punhado de tecnologias para rastrear equipamentos de forma confiável e com precisão líder do sector.
Ultra-wideband (UWB) é um protocolo de comunicação sem fios de curto alcance - como Wi-Fi ou Bluetooth, que usa ondas de rádio de pulsos curtos num espectro de frequências que varia de 3,1 a 10,5 GHz. A sua combinação única de características de sinal - uma resolução temporal fina e a resistência a interferências e reflexões - torna-o uma escolha segura, fiável e precisa para rastreamento de equipamentos.
Descubra mais.Usando os chips de GPS mais recentes, podemos rastrear de maneira confiável equipamentos externos com precisão sub métrica e, em alguns casos, também internos, combinando sinais de vários satélites.
IMUs podem medir forças, taxas angulares e orientação usando uma combinação de acelerómetros e giroscópios. Permite o rastreamento preciso da localização em trajectórias curtas em caso de oclusões ou perda de sinal de GPS ou UWB.
Um código de barras, composto por barras e espaços, é uma representação legível por máquina de números e caracteres. Hoje, as riscas apresentadas abaixo nas embalagens dos produtos vendidos em supermercados, lojas de conveniência e outras lojas são omnipresentes.
Utiliza campos electromagnéticos para identificar e seguir automaticamente as tags fixadas aos objectos. Um sistema RFID é composto por um pequeno transponder de rádio, um receptor e um transmissor de rádio. Quando accionada por um impulso de interrogação electromagnética de um leitor RFID próximo, a tag devolve ao leitor dados digitais, normalmente um número de inventário que a identifica.
Ao combinar os dados de vários sensores físicos por meio de algoritmos de fusão, pode-se alcançar um desempenho de rastreamento preciso e robusto.
UWB, GPS, IMU, RFID, QR and sensor fusion on one floor; TWR and TDoA
The floor itself
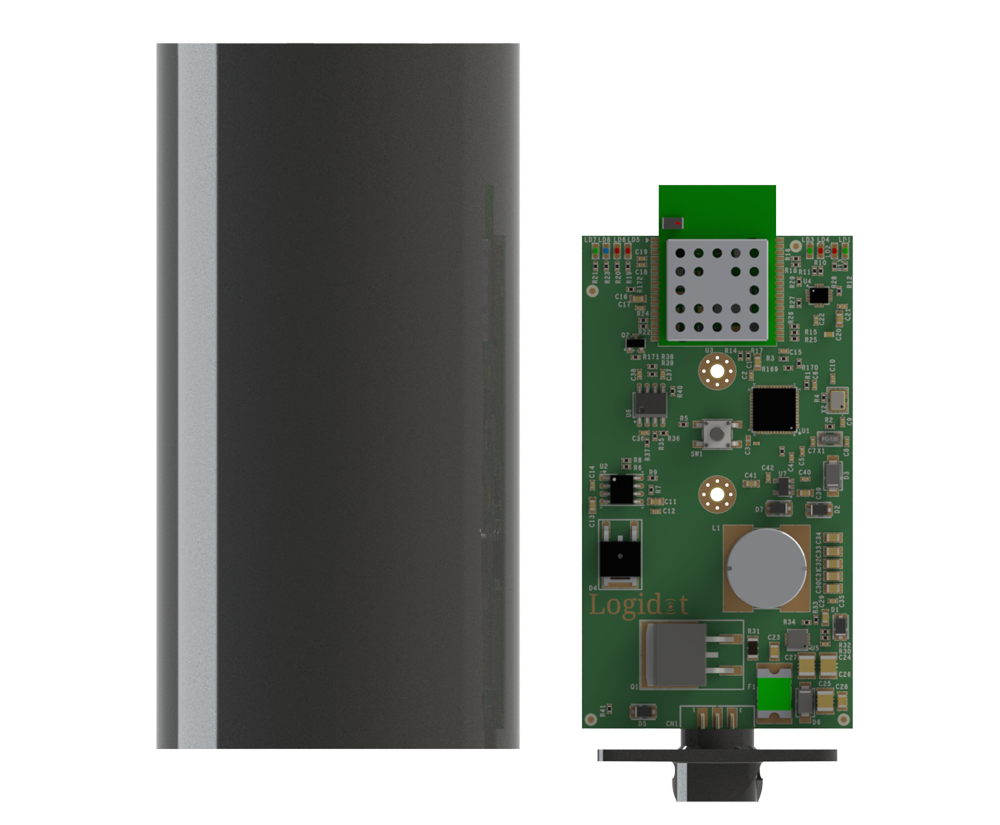
Fixed sensor-set that provide location to moving targets, include UWB sensor. Can use the embeeded battery for months of life-cycle or be connected to your power maze.
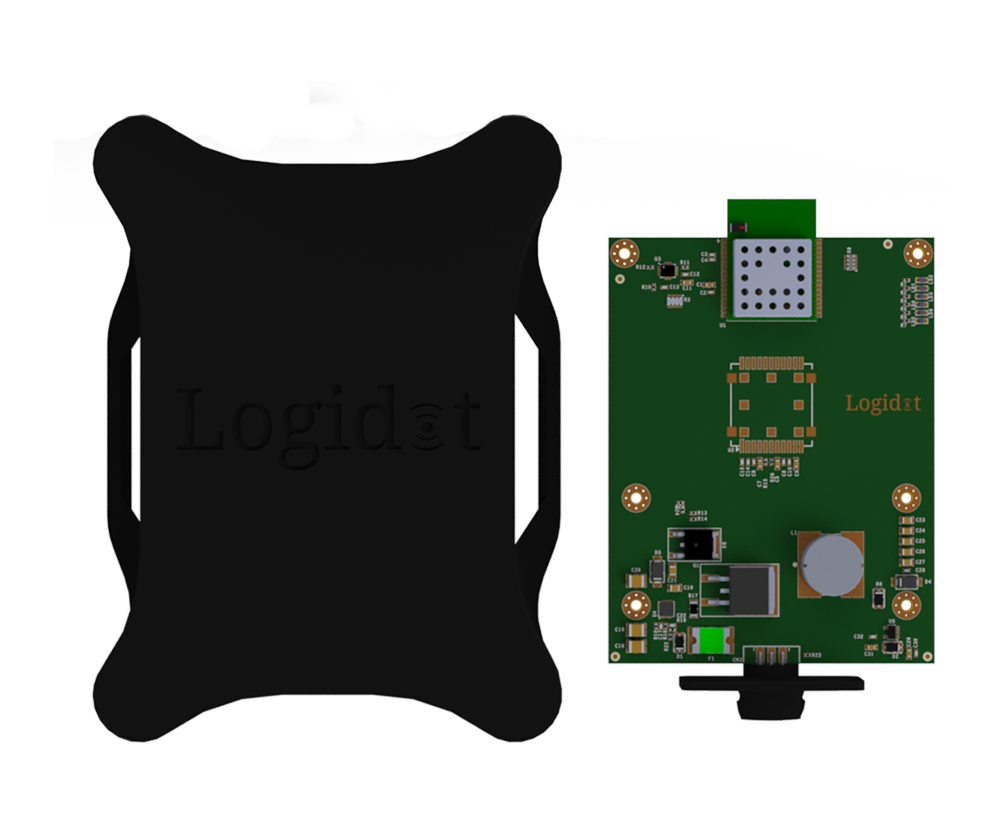
Interfaces with our gateway, integrates UWB, a 6-axis IMU (accelerometer and gyroscope) and GPS. Battery life of one week with the option to be attached directly to the vehicle power source.
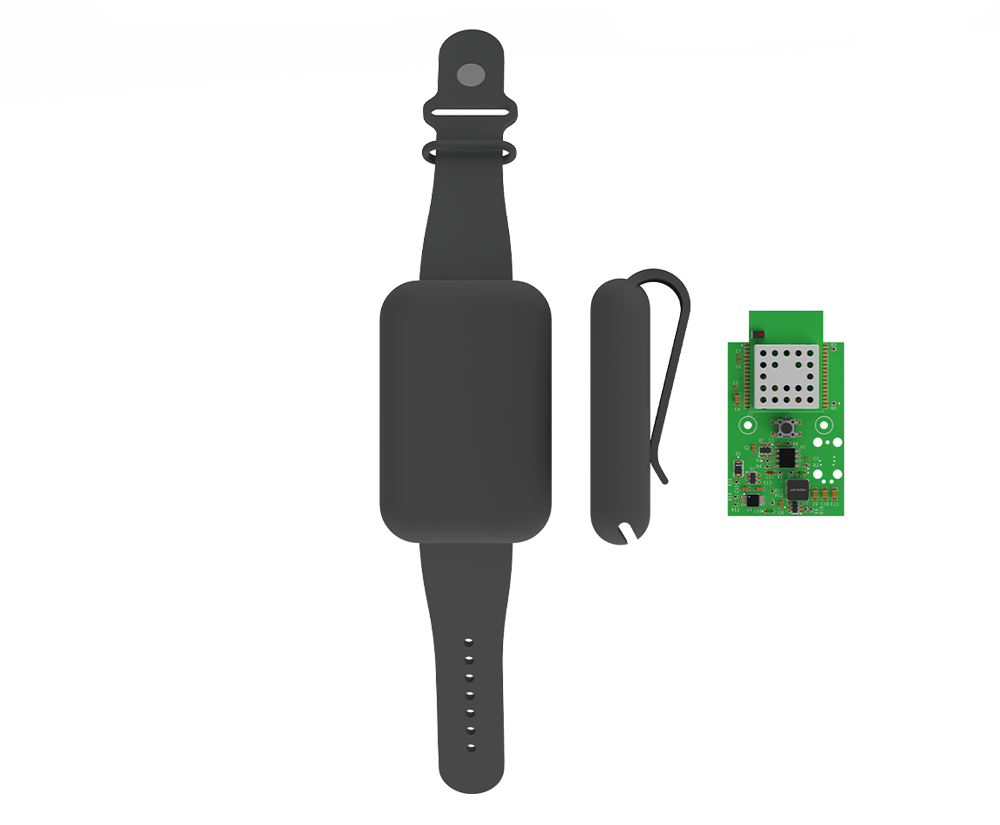
Interfaces with our gateway, integrates UWB and a 3-axis accelerometer. Battery life of one day.
The layer the other two stand on: tags on the vehicles and the people, anchors on the racking, a gateway off the floor. What they measure leaves the building once and arrives in the cloud as position, identity and status.
Folha de Dados
Anchor, vehicle tag, wearable tag, and the four data sheets
Nossa plataforma IOT em tempo real fornece dados de localização, ID e dados de estado para vários equipamentos e tradu-los em processos mensuráveis. A plataforma, portanto, permite monitorizar, optimizar e automatizar processos de produção e logística. A arquitectura aberta e altamente elástica permite uma integração fácil e um ROI rápido.
Anchors are the building’s reference points. Screwed, magneted or strapped to racking, columns and walls, each one ranges every tag in view over UWB — months on the internal battery, or wired into site power.
The gateway is the one box between the floor and the platform: it collects what the anchors hear and forwards it over whatever the site already has — Ethernet, Wi-Fi or a mobile connection.
A wearable tag puts the people on the floor on the same live map as the vehicles — UWB for position and a 3-axis accelerometer for what they are doing. A day on a charge, and nothing to operate.
Forklifts, pallet trucks and tugs carry a vehicle tag. UWB indoors, a 6-axis IMU for motion and GPS when the work goes outside — a week on battery, or taken straight off the vehicle’s own power.
Every position lands against your own floor plan, so the dashboard shows zones, dwell and routes rather than dots — live within seconds, analysed within minutes, and available through the API to the WMS, ERP or MES you already run.
The architecture is open at the edge too. Sensors you already have — presence, environment, gates, scanners — stream in beside Logidot’s own, so one platform carries the whole picture.
Where the work is done
Hosted for you, so there is nothing to install or keep running on site. Analytic services turn tracks into measures, the intelligence layer reads those measures against how the operation is meant to run, the reporting tools assemble what comes out, the dashboard support services serve the live view, and storage keeps the history — backed up daily and encrypted end to end.
Logidot Cloud, taken apart
The system of record you already run
The warehouse management system stays where it is. Logidot exchanges data with it in both directions — plugins for the most common providers, or an integration built for yours — so real-time position can retire the manual, error-prone steps around it instead of adding another screen.
The operation, run forward
The same data drives a model of your floor you can run forward: layouts, resource allocation, picking strategies and stock placement tried against a shift before anything moves in the building.
Positions become measures
Where tracks turn into the numbers an operation is run on: time by zone, travelled time against order fulfilment, spaghetti maps, utilisation and productivity. Analysed within five minutes of the movement itself.
Measures become judgements
What the analytics measure is read against how the operation is meant to run, so that a busy hour can be told from an unusual one and a pattern worth acting on from noise. It is what turns the numbers below it into the judgements the automation layer acts on — the three together are one pipeline, from position to insight to action.
Supervision, automated
Rules you set watch the live picture for you and flag the anomalies — a vehicle in a restricted zone, an asset that has not moved, a check that was skipped — while the reporting tool sends the regular numbers out without anyone assembling them.
What everything above stands on
The real-time location layer. UWB ranging from the anchors, motion from the tags and GPS where the work goes outdoors, fused into one position per asset against your own floor plan — 3D to 10 cm, up to 16 Hz, on screen within three seconds. Vehicles, goods, maintenance and people all arrive here first.
For the systems
Everything the platform knows is available over REST, so the systems that run the work can read it directly rather than through a person copying numbers between screens.
For the office
The live view and the reports in a browser: wherever you are, sign in and the floor is on screen as it is now, with the history behind it.
For the floor
The same platform in a hand on the floor — checks before a vehicle is used, a log of who used what and when, and the picture where the work is happening rather than back at a desk.
The RTLS platform, the four services on it, the WMS across the top and the three surfaces
Where the operation is read
What your people actually open: the web dashboard with the live map and the charts behind it, the mobile apps on the floor, and the integrations that put the same picture inside the tools they already use.
For the systems
Everything the platform knows is available over REST, so the systems that run the work can read it directly rather than through a person copying numbers between screens.
For the office
The live view and the reports in a browser: wherever you are, sign in and the floor is on screen as it is now, with the history behind it.
For the floor
The same platform in a hand on the floor — checks before a vehicle is used, a log of who used what and when, and the picture where the work is happening rather than back at a desk.
Web dashboard, mobile apps and the REST API
Your data, coming the other way
Orders, stock and master data come the other way, from the systems of record into the platform, so a position on the map is a pallet with an order behind it rather than an anonymous dot.
The system of record you already run
The warehouse management system stays where it is. Logidot exchanges data with it in both directions — plugins for the most common providers, or an integration built for yours — so real-time position can retire the manual, error-prone steps around it instead of adding another screen.
For the systems
Everything the platform knows is available over REST, so the systems that run the work can read it directly rather than through a person copying numbers between screens.
Customer data in, located goods out
Ambiente de teste
Modele uma operação antes de instalar um único sensor. O simulador anima a planta do seu armazém com movimentos realistas de veículos e operadores de separação, e a plataforma trata-a exactamente como uma instalação real em funcionamento — o mesmo mapa, os mesmos alertas e os mesmos relatórios que veria no primeiro dia.
Ambiente de teste
O a sério corre sobre a sua planta, dentro da plataforma. Este tem o mesmo ciclo de trabalho e os mesmos comandos sobre um piso de exemplo — 64 por 36 metros, 280 localizações de picking, quatro zonas e uma frota que é sua.
O piso precisa de JavaScript para funcionar. Os controlos abaixo descrevem o que ele faz.
Clique numa localização para encomendar essa linha já. Clique num veículo para o seguir.
Frota
Procura e movimentação
| Veículo | Atividade | Encomendas | km | Bateria |
|---|---|---|---|---|
| Nenhum veículo no piso. Acrescente um e as encomendas começam a andar. | ||||
Acabou de acontecer
O que este deixa de fora
Um piso, um turno, atribuição ao veículo livre mais próximo e física simplificada — uma aritmética leve o suficiente para correr a sessenta imagens por segundo num separador. O simulador de produção planeia sobre a sua própria planta, calcula turnos e equipas, e repete meses do seu histórico de encomendas.
A simulated floor: 64 by 36 metres, four zones, a fleet you control
The platform, asked in plain language
The same measures, asked for in words rather than built into a report: which aisles cost the most walking this week, why an alert fired at 04:12, what would change if the fast movers moved bay. The assistant reads what the platform already knows — live position, zone analytics, the rule events, the history — answers with the numbers it used, and hands anything it proposes to the simulator, so a change is tried against a shift before it is made on the floor. It runs beside the platform on servers we host, signed in with the same account as the dashboard.
A question, the data it was answered from, and the change tried before it is made
| Tecnologia | Precisão | Alcance | Localização | Applicações | Duração Âncora | Duração Tag | Custo da Infra-estrutura | Facilidade de Instalaão/Uso |
|---|---|---|---|---|---|---|---|---|
| Wi-Fi |
 <20 m
<20 m
|
 <150 m
|
 2D
2D
|
 Médio
Médio
|
 Médio
Médio
|
Baixo
|

|

|
| Bluetooth (BLE) |
 <6 m
<6 m
|
 <50 m
<50 m
|
2D
|
 Médio
Médio
|
Médio
|
Alto
|

|

|
| RFID/NFC |
 <10 cm
|
 <1cm
<1cm
|
 Local
Local
|
Baixo
|
 Passivo
|
 Baixo
Baixo
|
|
|
| Existing UWB |
 <20 cm
|
<100 m
|
 2D/3D
2D/3D
|
 Baixo
Baixo
|
Alto com TDoA
|
 Baixo
Baixo
|
|
|
| Logidot |
<20 cm
|
<100m
|
2D/3D
|
Alto
|
Alto com TDoA
|
Alto
|
|
|

até 10cm de precisão em 3D e baixa latência
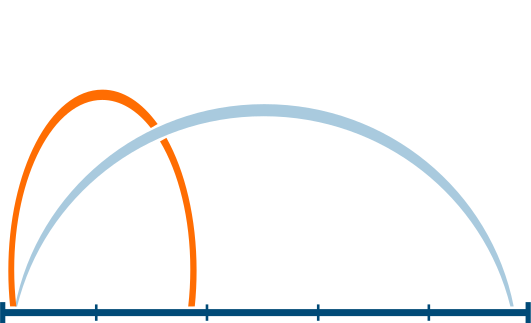
até 16Hz
até 50m de distância inter sensor

contra reflexos, ruído, vibrações e choques

simplesmente adicione mais beacons
pode ser instalado em questão de minutos
Peça um demo hoje!
Pedir Demo