Pick a layer to read it, or jump to its section.
Client-side applications, the Logidot Cloud, the physical hardware and the WMS / ERP

La nostra tecnologia
Per potenziare la trasformazione digitale delle tue operazioni, devi conoscere la posizione e lo stato preciso delle risorse rilevanti in officina. Inoltre, è necessario collegarli in tempo reale e potenziarli con la potenza di calcolo, in modo che interagiscano nel modo più veloce e intelligente possibile. Logidot ti aiuta a raggiungere questo obiettivo attraverso tre tecnologie principali: RTLS, piattaforma IOT e simulatore.
Pick a layer to read it, or jump to its section.
Client-side applications, the Logidot Cloud, the physical hardware and the WMS / ERP
RTLS
Logidot combina una manciata di tecnologie per monitorare in modo affidabile le risorse con una precisione leader del settore.
La banda ultra larga (UWB) è un protocollo di comunicazione wireless a corto raggio, come Wi-Fi o Bluetooth, che utilizza onde radio di impulsi brevi su uno spettro di frequenze che vanno da 3,1 a 10,5 GHz. La sua combinazione unica di caratteristiche del segnale - una risoluzione temporale fine e la resistenza a interferenze e riflessioni - ne fa una scelta sicura, affidabile e accurata per il monitoraggio delle risorse.
Scopri di più.Utilizzando i più recenti chip GPS, possiamo tracciare in modo affidabile le risorse all'aperto con una precisione inferiore al metro e in alcuni casi anche all'interno combinando segnali da più satelliti.
Le IMU possono misurare forze, velocità angolari e orientamento utilizzando una combinazione di accelerometri e giroscopi. Consente un rilevamento della posizione accurato su traiettorie brevi in caso di occlusioni o perdita del segnale GPS o UWB.
Un codice a barre, composto da barre e spazi, è una rappresentazione leggibile dalla macchina di numeri e caratteri. Oggi le strisce mostrate di seguito sulle confezioni dei prodotti venduti in supermercati, minimarket e altri negozi sono onnipresenti.
Utilizza campi elettromagnetici per identificare e tracciare automaticamente i tag applicati agli oggetti. Un sistema RFID è composto da un minuscolo transponder radio, un ricevitore e un trasmettitore radio. Quando viene attivato da un impulso di interrogazione elettromagnetica di un lettore RFID nelle vicinanze, il tag ritrasmette al lettore dati digitali, di solito un numero di inventario che lo identifica.
Combinando i dati di più sensori fisici tramite algoritmi di fusione, è possibile ottenere prestazioni di tracciamento accurate e robuste.
UWB, GPS, IMU, RFID, QR and sensor fusion on one floor; TWR and TDoA
The floor itself
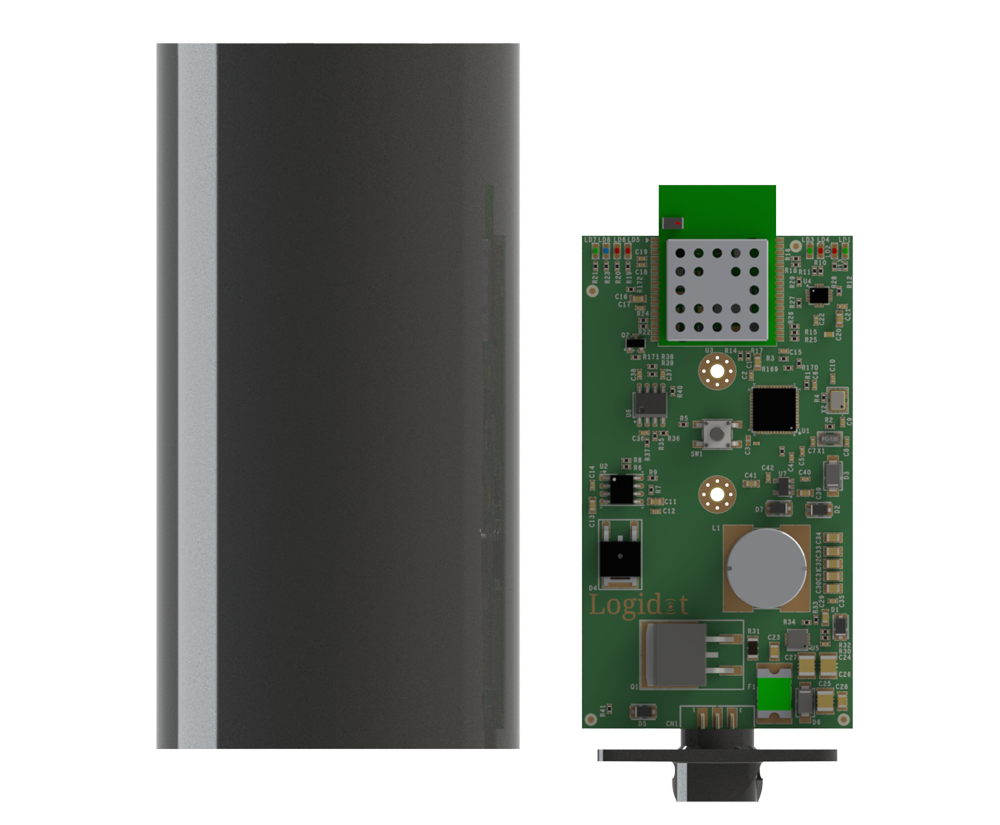
Fixed sensor-set that provide location to moving targets, include UWB sensor. Can use the embeeded battery for months of life-cycle or be connected to your power maze.
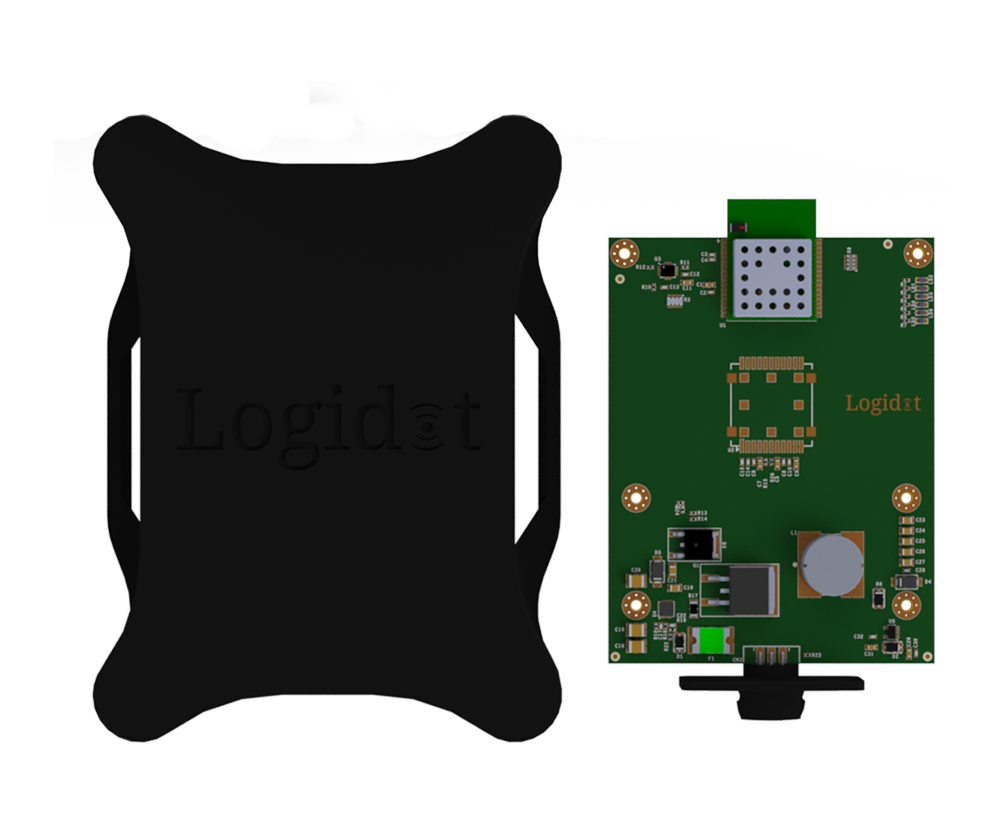
Interfaces with our gateway, integrates UWB, a 6-axis IMU (accelerometer and gyroscope) and GPS. Battery life of one week with the option to be attached directly to the vehicle power source.
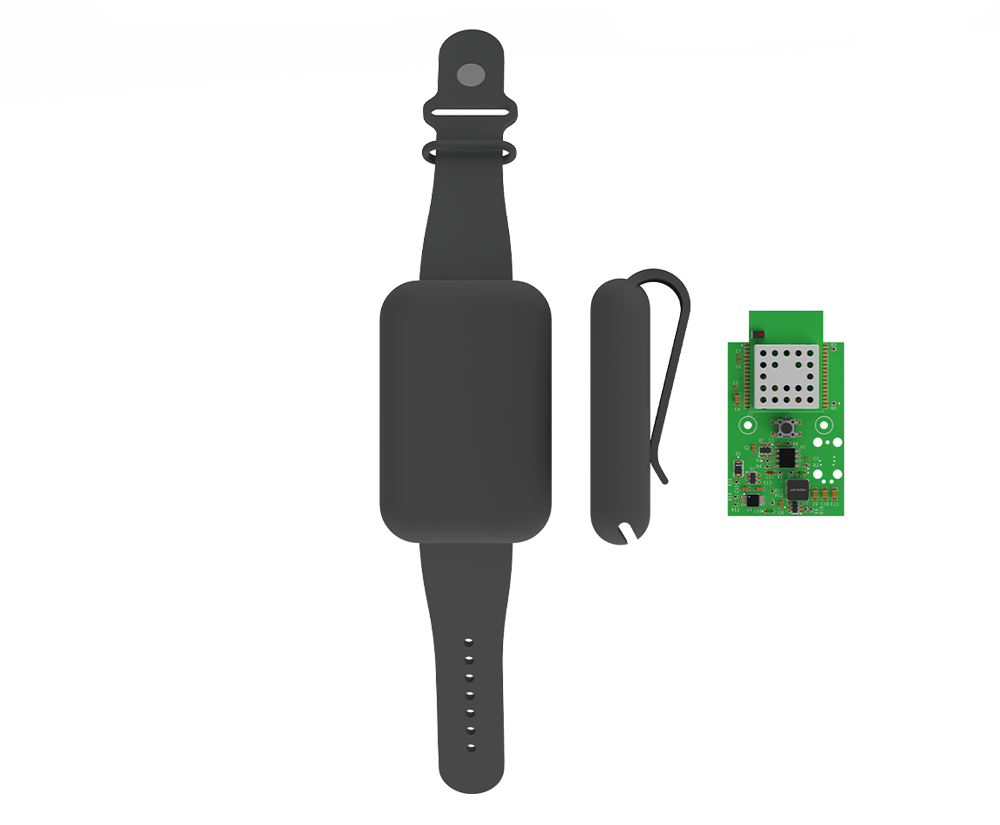
Interfaces with our gateway, integrates UWB and a 3-axis accelerometer. Battery life of one day.
The layer the other two stand on: tags on the vehicles and the people, anchors on the racking, a gateway off the floor. What they measure leaves the building once and arrives in the cloud as position, identity and status.
Scheda dati
Anchor, vehicle tag, wearable tag, and the four data sheets
La nostra piattaforma IOT in tempo reale fornisce dati su posizione, ID e stato per varie risorse e si traduce in processi misurabili. La piattaforma consente quindi di monitorare, ottimizzare e automatizzare i processi di produzione e logistica. L'architettura aperta ed altamente elastica consente una facile integrazione e un rapido ROI.
Anchors are the building’s reference points. Screwed, magneted or strapped to racking, columns and walls, each one ranges every tag in view over UWB — months on the internal battery, or wired into site power.
The gateway is the one box between the floor and the platform: it collects what the anchors hear and forwards it over whatever the site already has — Ethernet, Wi-Fi or a mobile connection.
A wearable tag puts the people on the floor on the same live map as the vehicles — UWB for position and a 3-axis accelerometer for what they are doing. A day on a charge, and nothing to operate.
Forklifts, pallet trucks and tugs carry a vehicle tag. UWB indoors, a 6-axis IMU for motion and GPS when the work goes outside — a week on battery, or taken straight off the vehicle’s own power.
Every position lands against your own floor plan, so the dashboard shows zones, dwell and routes rather than dots — live within seconds, analysed within minutes, and available through the API to the WMS, ERP or MES you already run.
The architecture is open at the edge too. Sensors you already have — presence, environment, gates, scanners — stream in beside Logidot’s own, so one platform carries the whole picture.
Where the work is done
Hosted for you, so there is nothing to install or keep running on site. Analytic services turn tracks into measures, the intelligence layer reads those measures against how the operation is meant to run, the reporting tools assemble what comes out, the dashboard support services serve the live view, and storage keeps the history — backed up daily and encrypted end to end.
Logidot Cloud, taken apart
The system of record you already run
The warehouse management system stays where it is. Logidot exchanges data with it in both directions — plugins for the most common providers, or an integration built for yours — so real-time position can retire the manual, error-prone steps around it instead of adding another screen.
The operation, run forward
The same data drives a model of your floor you can run forward: layouts, resource allocation, picking strategies and stock placement tried against a shift before anything moves in the building.
Positions become measures
Where tracks turn into the numbers an operation is run on: time by zone, travelled time against order fulfilment, spaghetti maps, utilisation and productivity. Analysed within five minutes of the movement itself.
Measures become judgements
What the analytics measure is read against how the operation is meant to run, so that a busy hour can be told from an unusual one and a pattern worth acting on from noise. It is what turns the numbers below it into the judgements the automation layer acts on — the three together are one pipeline, from position to insight to action.
Supervision, automated
Rules you set watch the live picture for you and flag the anomalies — a vehicle in a restricted zone, an asset that has not moved, a check that was skipped — while the reporting tool sends the regular numbers out without anyone assembling them.
What everything above stands on
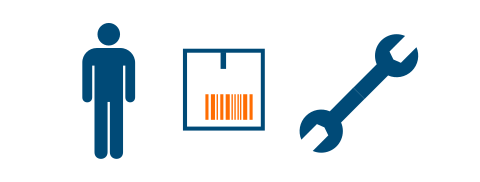
The real-time location layer. UWB ranging from the anchors, motion from the tags and GPS where the work goes outdoors, fused into one position per asset against your own floor plan — 3D to 10 cm, up to 16 Hz, on screen within three seconds. Vehicles, goods, maintenance and people all arrive here first.
For the systems
Everything the platform knows is available over REST, so the systems that run the work can read it directly rather than through a person copying numbers between screens.
For the office
The live view and the reports in a browser: wherever you are, sign in and the floor is on screen as it is now, with the history behind it.
For the floor
The same platform in a hand on the floor — checks before a vehicle is used, a log of who used what and when, and the picture where the work is happening rather than back at a desk.
The RTLS platform, the four services on it, the WMS across the top and the three surfaces
Where the operation is read
What your people actually open: the web dashboard with the live map and the charts behind it, the mobile apps on the floor, and the integrations that put the same picture inside the tools they already use.
For the systems
Everything the platform knows is available over REST, so the systems that run the work can read it directly rather than through a person copying numbers between screens.
For the office
The live view and the reports in a browser: wherever you are, sign in and the floor is on screen as it is now, with the history behind it.
For the floor
The same platform in a hand on the floor — checks before a vehicle is used, a log of who used what and when, and the picture where the work is happening rather than back at a desk.
Web dashboard, mobile apps and the REST API
Your data, coming the other way
Orders, stock and master data come the other way, from the systems of record into the platform, so a position on the map is a pallet with an order behind it rather than an anonymous dot.
The system of record you already run
The warehouse management system stays where it is. Logidot exchanges data with it in both directions — plugins for the most common providers, or an integration built for yours — so real-time position can retire the manual, error-prone steps around it instead of adding another screen.
For the systems
Everything the platform knows is available over REST, so the systems that run the work can read it directly rather than through a person copying numbers between screens.
Customer data in, located goods out
Ambiente di prova
Modella un'operazione prima ancora che venga installato un solo sensore. Il simulatore anima la tua planimetria con movimenti realistici di veicoli e addetti al prelievo, e la piattaforma la tratta esattamente come un impianto reale in funzione — la stessa mappa, gli stessi avvisi, gli stessi report che vedresti il primo giorno.
Ambiente di prova
Quello vero gira sulla tua planimetria, dentro la piattaforma. Questo ha lo stesso ciclo di lavoro e gli stessi comandi su una superficie di esempio — 64 metri per 36, 280 vani di prelievo, quattro zone e una flotta che guidi tu.
La superficie ha bisogno di JavaScript. I comandi qui sotto descrivono cosa fa.
Clicca su un vano per ordinare subito quella riga. Clicca su un mezzo per seguirlo.
Flotta
Domanda e movimentazione
| Mezzo | Attività | Ordini | km | Batteria |
|---|---|---|---|---|
| Nessun mezzo in superficie. Aggiungine uno e gli ordini iniziano a muoversi. | ||||
Appena successo
Che cosa lascia fuori
Una superficie, un turno, assegnazione al mezzo libero più vicino e fisica semplificata — una matematica abbastanza leggera da girare a sessanta fotogrammi al secondo in una scheda. Il simulatore di produzione pianifica sulla tua planimetria, calcola turni e organici e riproduce mesi del tuo storico ordini.
A simulated floor: 64 by 36 metres, four zones, a fleet you control
The platform, asked in plain language
The same measures, asked for in words rather than built into a report: which aisles cost the most walking this week, why an alert fired at 04:12, what would change if the fast movers moved bay. The assistant reads what the platform already knows — live position, zone analytics, the rule events, the history — answers with the numbers it used, and hands anything it proposes to the simulator, so a change is tried against a shift before it is made on the floor. It runs beside the platform on servers we host, signed in with the same account as the dashboard.
A question, the data it was answered from, and the change tried before it is made
| Tecnologia | Precisione | Raggiungere | Posizione | Applicazione | Ancoraggio Durata | Etichetta Durata | Costo Infrastrutturale | Facilità Implementazione/Utilizzo |
|---|---|---|---|---|---|---|---|---|
| Wi-Fi |
 <20 m
<20 m
|
 <150 m
|
 2D
2D
|
 Medio
Medio
|
 Medio
Medio
|
Basso
|

|

|
| Bluetooth (BLE) |
 <6 m
<6 m
|
 <50 m
<50 m
|
2D
|
 Medio
Medio
|
Medio
|
Alto
|

|

|
| RFID/NFC |
 <10 cm
|
 <1cm
<1cm
|
 Individuare
|
Basso
|
 Passivo
|
 Basso
Basso
|
|
|
| Existing UWB |
 <20 cm
|
<100 m
|
 2D/3D
2D/3D
|
 Basso
Basso
|
Alto con TDoA
|
 Basso
Basso
|
|
|
| Logidot |
<20 cm
|
<100m
|
2D/3D
|
Alto
|
Alto con TDoA
|
Alto
|
|
|
fino a 10 cm di precisione in 3D e bassa latenza
fino a 16Hz
fino a 50m di distanza tra i sensori

contro riflessi, rumori, vibrazioni e urti
aggiungi semplicemente più beacon
può essere implementato in pochi minuti
Richiedi una demo oggi!
Richiedi demo