Pick a layer to read it, or jump to its section.
Client-side applications, the Logidot Cloud, the physical hardware and the WMS / ERP

Notre technologie
Pour permettre la transformation numérique de vos opérations, vous devez connaître l'emplacement précis et le statut des actifs pertinents sur le sol de l'atelier. De plus, vous devez les connecter en temps réel et les améliorer avec une puissance de calcul, afin qu'ils interagissent de la manière la plus rapide et la plus intelligente possible. Logidot vous aide à atteindre cet objectif grâce à trois technologies de base: RTLS, plate-forme IOT et simulateur.
Pick a layer to read it, or jump to its section.
Client-side applications, the Logidot Cloud, the physical hardware and the WMS / ERP
RTLS
Logidot combine une poignée de technologies pour suivre de manière fiable les actifs avec une précision de pointe.
L'ultra large bande (UWB) est un protocole de communication sans fil à courte portée - comme le Wi-Fi ou le Bluetooth, qui utilise des ondes radio d'impulsions courtes sur un spectre de fréquences allant de 3,1 à 10,5 GHz. Sa combinaison unique de caractéristiques de signal - une résolution temporelle fine et une résistance aux interférences et aux réflexions - en fait un choix sûr, fiable et précis pour le suivi des actifs.
En savoir plus.En utilisant les dernières puces GPS, nous pouvons suivre de manière fiable les actifs à l'extérieur avec une précision submétrique et dans certains cas également à l'intérieur en combinant les signaux de plusieurs satellites.
Les IMU peuvent mesurer les forces, les vitesses angulaires et l'orientation à l'aide d'une combinaison d'accéléromètres et de gyroscopes. Il permet un suivi précis de la localisation sur de courtes trajectoires en cas d'occlusion ou de perte du signal GPS ou UWB.
Un code-barres, composé de barres et d'espaces, est une représentation lisible par machine de chiffres et de caractères. Aujourd'hui, les rayures présentées ci-dessous sur les emballages des produits vendus dans les supermarchés, les commerces de proximité et d'autres magasins sont omniprésentes.
Utilise des champs électromagnétiques pour identifier et suivre automatiquement les balises fixées aux objets. Un système RFID se compose d'un minuscule transpondeur radio, d'un récepteur et d'un émetteur radio. Lorsqu'elle est activée par une impulsion d'interrogation électromagnétique émise par un lecteur RFID à proximité, la balise renvoie au lecteur des données numériques, généralement un numéro d'inventaire servant à l'identifier.
By combining the data from multiple physical sensors via fusion algorithms, an accurate and robust tracking performance can be achieved.
UWB, GPS, IMU, RFID, QR and sensor fusion on one floor; TWR and TDoA
The floor itself
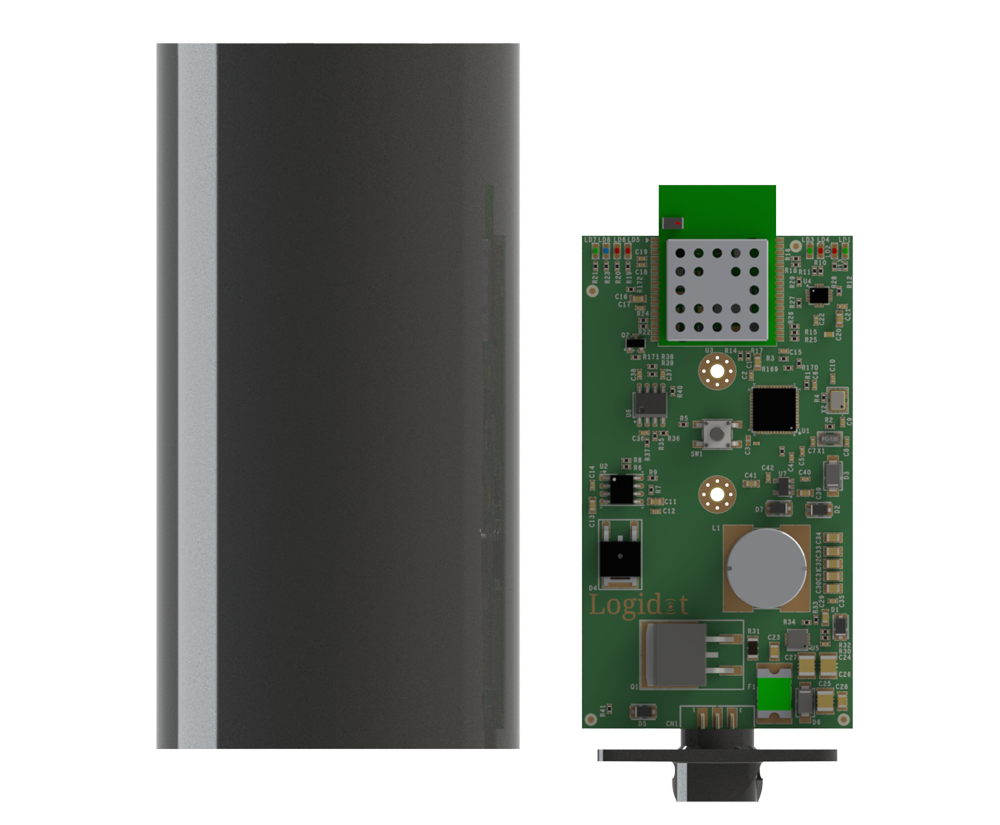
Fixed sensor-set that provide location to moving targets, include UWB sensor. Can use the embeeded battery for months of life-cycle or be connected to your power maze.
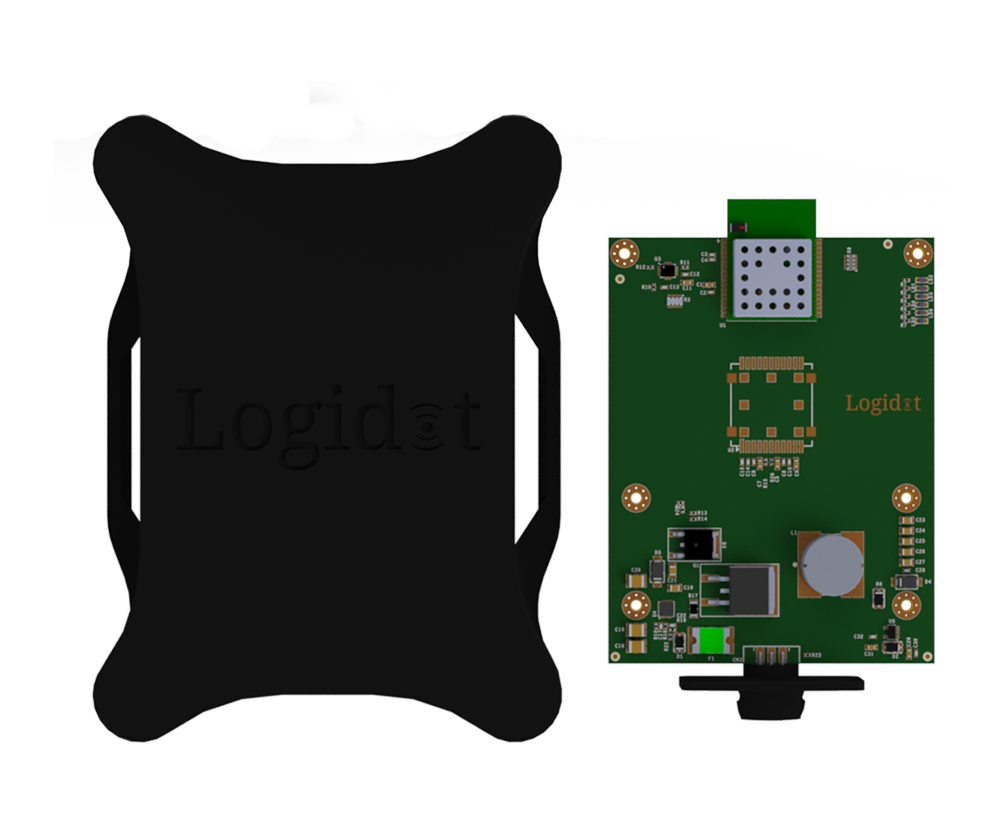
Interfaces with our gateway, integrates UWB, a 6-axis IMU (accelerometer and gyroscope) and GPS. Battery life of one week with the option to be attached directly to the vehicle power source.
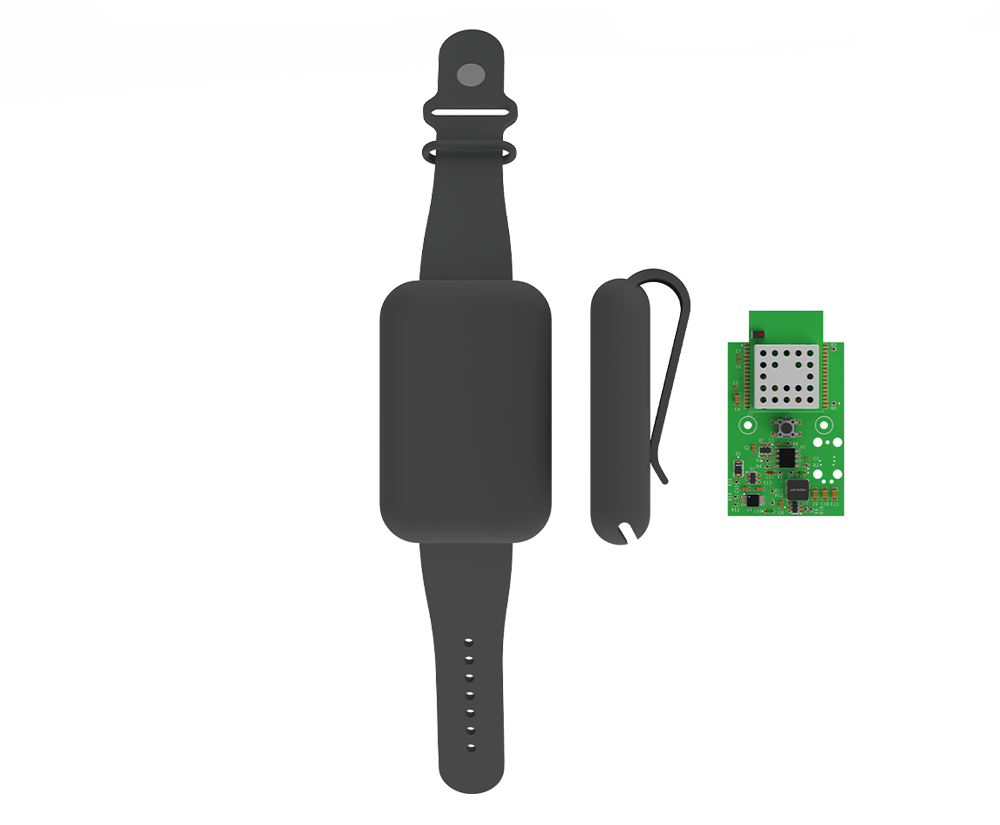
Interfaces with our gateway, integrates UWB and a 3-axis accelerometer. Battery life of one day.
The layer the other two stand on: tags on the vehicles and the people, anchors on the racking, a gateway off the floor. What they measure leaves the building once and arrives in the cloud as position, identity and status.
Fiche technique
Anchor, vehicle tag, wearable tag, and the four data sheets
Notre plate-forme IOT en temps réel fournit des données de localisation, d'identification et de statut pour divers actifs et se traduit par des processus mesurables. La plateforme permet ainsi de suivre, d'optimiser et d'automatiser les processus de production et de logistique. L'architecture ouverte et hautement élastique permet une intégration facile et un retour sur investissement rapide.
Anchors are the building’s reference points. Screwed, magneted or strapped to racking, columns and walls, each one ranges every tag in view over UWB — months on the internal battery, or wired into site power.
The gateway is the one box between the floor and the platform: it collects what the anchors hear and forwards it over whatever the site already has — Ethernet, Wi-Fi or a mobile connection.
A wearable tag puts the people on the floor on the same live map as the vehicles — UWB for position and a 3-axis accelerometer for what they are doing. A day on a charge, and nothing to operate.
Forklifts, pallet trucks and tugs carry a vehicle tag. UWB indoors, a 6-axis IMU for motion and GPS when the work goes outside — a week on battery, or taken straight off the vehicle’s own power.
Every position lands against your own floor plan, so the dashboard shows zones, dwell and routes rather than dots — live within seconds, analysed within minutes, and available through the API to the WMS, ERP or MES you already run.
The architecture is open at the edge too. Sensors you already have — presence, environment, gates, scanners — stream in beside Logidot’s own, so one platform carries the whole picture.
Where the work is done
Hosted for you, so there is nothing to install or keep running on site. Analytic services turn tracks into measures, the intelligence layer reads those measures against how the operation is meant to run, the reporting tools assemble what comes out, the dashboard support services serve the live view, and storage keeps the history — backed up daily and encrypted end to end.
Logidot Cloud, taken apart
The system of record you already run
The warehouse management system stays where it is. Logidot exchanges data with it in both directions — plugins for the most common providers, or an integration built for yours — so real-time position can retire the manual, error-prone steps around it instead of adding another screen.
The operation, run forward
The same data drives a model of your floor you can run forward: layouts, resource allocation, picking strategies and stock placement tried against a shift before anything moves in the building.
Positions become measures
Where tracks turn into the numbers an operation is run on: time by zone, travelled time against order fulfilment, spaghetti maps, utilisation and productivity. Analysed within five minutes of the movement itself.
Measures become judgements
What the analytics measure is read against how the operation is meant to run, so that a busy hour can be told from an unusual one and a pattern worth acting on from noise. It is what turns the numbers below it into the judgements the automation layer acts on — the three together are one pipeline, from position to insight to action.
Supervision, automated
Rules you set watch the live picture for you and flag the anomalies — a vehicle in a restricted zone, an asset that has not moved, a check that was skipped — while the reporting tool sends the regular numbers out without anyone assembling them.
What everything above stands on
The real-time location layer. UWB ranging from the anchors, motion from the tags and GPS where the work goes outdoors, fused into one position per asset against your own floor plan — 3D to 10 cm, up to 16 Hz, on screen within three seconds. Vehicles, goods, maintenance and people all arrive here first.
For the systems
Everything the platform knows is available over REST, so the systems that run the work can read it directly rather than through a person copying numbers between screens.
For the office
The live view and the reports in a browser: wherever you are, sign in and the floor is on screen as it is now, with the history behind it.
For the floor
The same platform in a hand on the floor — checks before a vehicle is used, a log of who used what and when, and the picture where the work is happening rather than back at a desk.
The RTLS platform, the four services on it, the WMS across the top and the three surfaces
Where the operation is read
What your people actually open: the web dashboard with the live map and the charts behind it, the mobile apps on the floor, and the integrations that put the same picture inside the tools they already use.
For the systems
Everything the platform knows is available over REST, so the systems that run the work can read it directly rather than through a person copying numbers between screens.
For the office
The live view and the reports in a browser: wherever you are, sign in and the floor is on screen as it is now, with the history behind it.
For the floor
The same platform in a hand on the floor — checks before a vehicle is used, a log of who used what and when, and the picture where the work is happening rather than back at a desk.
Web dashboard, mobile apps and the REST API
Your data, coming the other way
Orders, stock and master data come the other way, from the systems of record into the platform, so a position on the map is a pallet with an order behind it rather than an anonymous dot.
The system of record you already run
The warehouse management system stays where it is. Logidot exchanges data with it in both directions — plugins for the most common providers, or an integration built for yours — so real-time position can retire the manual, error-prone steps around it instead of adding another screen.
For the systems
Everything the platform knows is available over REST, so the systems that run the work can read it directly rather than through a person copying numbers between screens.
Customer data in, located goods out
Bac à sable
Modélisez une exploitation avant l'installation du moindre capteur. Le simulateur anime votre propre plan d'implantation avec des déplacements réalistes de véhicules et de préparateurs de commandes, et la plateforme le traite exactement comme un site en exploitation — la même carte, les mêmes alertes, les mêmes rapports que vous verriez dès le premier jour.
Bac à sable
Le vrai tourne sur votre plan, dans la plateforme. Celui-ci a le même cycle de travail et les mêmes réglages sur une surface d'exemple — 64 mètres sur 36, 280 emplacements de prélèvement, quatre zones et une flotte que vous pilotez.
La surface a besoin de JavaScript. Les commandes ci-dessous décrivent ce qu'elle fait.
Cliquez sur un emplacement pour commander cette ligne tout de suite. Cliquez sur un engin pour le suivre.
Flotte
Demande et manutention
| Engin | Activité | Commandes | km | Batterie |
|---|---|---|---|---|
| Aucun engin sur la surface. Ajoutez-en un et les commandes se mettent en route. | ||||
Il vient de se passer
Ce que celui-ci laisse de côté
Une surface, un poste, une affectation au véhicule libre le plus proche et une physique simplifiée — un calcul assez léger pour tourner à soixante images par seconde dans un onglet. Le simulateur de production planifie sur votre propre plan, calcule postes et effectifs, et rejoue des mois de votre historique de commandes.
A simulated floor: 64 by 36 metres, four zones, a fleet you control
The platform, asked in plain language
The same measures, asked for in words rather than built into a report: which aisles cost the most walking this week, why an alert fired at 04:12, what would change if the fast movers moved bay. The assistant reads what the platform already knows — live position, zone analytics, the rule events, the history — answers with the numbers it used, and hands anything it proposes to the simulator, so a change is tried against a shift before it is made on the floor. It runs beside the platform on servers we host, signed in with the same account as the dashboard.
A question, the data it was answered from, and the change tried before it is made
| La technologie | Précision | Atteindre | Emplacement | Application | Ancre Durée | Balise Durée | Coût Infrastructures | Facilité Déploiement/Utilisation |
|---|---|---|---|---|---|---|---|---|
| Wi-Fi |
 <20 m
<20 m
|
 <150 m
|
 2D
2D
|
 Moyen
Moyen
|
 Moyen
Moyen
|
Meugler
|

|

|
| Bluetooth (BLE) |
 <6 m
<6 m
|
 <50 m
<50 m
|
2D
|
 Moyen
Moyen
|
Moyen
|
Élevé
|

|

|
| RFID/NFC |
 <10 cm
|
 <1cm
<1cm
|
 Endroit
|
Meugler
|
 Passif
|
 Meugler
|
|
|
| Existing UWB |
 <20 cm
|
<100 m
|
 2D/3D
2D/3D
|
 Meugler
|
Élevé avec TDoA
|
 Meugler
|
|
|
| Logidot |
<20 cm
|
<100m
|
2D/3D
|
Élevé
|
Élevé avec TDoA
|
Élevé
|
|
|
jusqu'à 10 cm de précision en 3D et faible latence
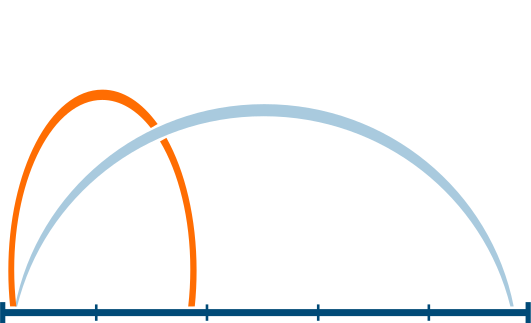
jusqu'à 16Hz
jusqu'à 50m de distance entre les capteurs

contre les reflets, le bruit, les vibrations et les chocs

ajoutez simplement plus de balises
peut être déployé en quelques minutes
Demandez une démo aujourd'hui!
Demander une démo