Pick a layer to read it, or jump to its section.
Client-side applications, the Logidot Cloud, the physical hardware and the WMS / ERP

Our Technology
To empower the digital transformation of your operations, you need to know the precise location and status of the relevant assets on the shop floor. In addition, you need to connect these in real-time and enhance them with computational power, so that they interact in the fastest and smartest way possible. Logidot helps you achieve this through three core technologies: RTLS, IOT platform and simulator.
Pick a layer to read it, or jump to its section.
Client-side applications, the Logidot Cloud, the physical hardware and the WMS / ERP
RTLS
Logidot combines a handful of technologies to reliably track assets with industry-leading accuracy.
Ultra-wideband (UWB) is a short-range wireless communication protocol - like Wi-Fi or Bluetooth - which uses radio waves of short pulses over a spectrum of frequencies ranging from 3.1 to 10.5 GHz. Its unique combination of signal characteristics - a fine time resolution and resistance to interference and reflections - makes it a secure, reliable and accurate choice for asset tracking.
Find out more.Using the latest GPS chips, we can reliably track assets outdoors with submeter accuracy and in some cases also indoors by combining signals from multiple satellites.
IMUs can measure forces, angular rates and orientation using a combination of accelerometers and gyroscopes. It allows for accurate location tracking over short trajectories in case of occlusions or GPS or UWB signal is lost.
A barcode, consisting of bars and spaces, is a machine-readable representation of numerals and characters. Today, stripes as shown below on packages of products sold at supermarkets, convenience stores and other stores are ubiquitous.
Uses electromagnetic fields to automatically identify and track tags attached to objects. An RFID system consists of a tiny radio transponder, a radio receiver and transmitter. When triggered by an electromagnetic interrogation pulse from a nearby RFID reader device, the tag transmits digital data, usually an identifying inventory number, back to the reader.
By combining the data from multiple physical sensors via fusion algorithms, an accurate and robust tracking performance can be achieved.
UWB, GPS, IMU, RFID, QR and sensor fusion on one floor; TWR and TDoA
The floor itself
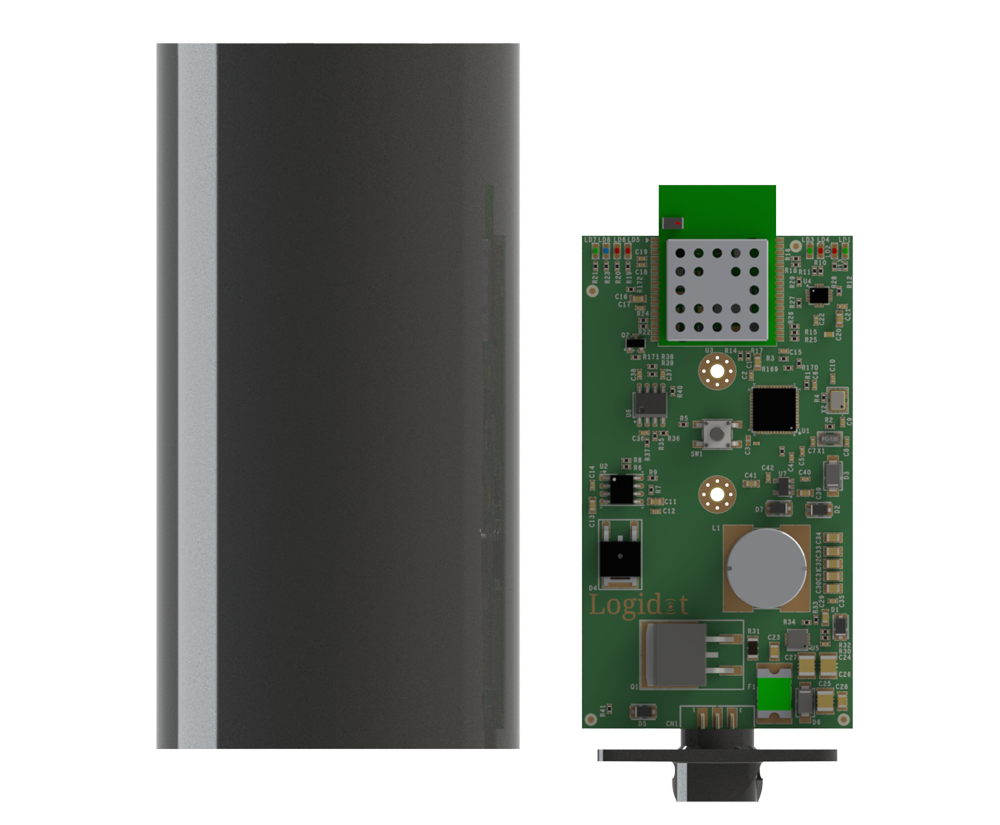
Fixed sensor-set that provide location to moving targets, include UWB sensor. Can use the embeeded battery for months of life-cycle or be connected to your power maze.
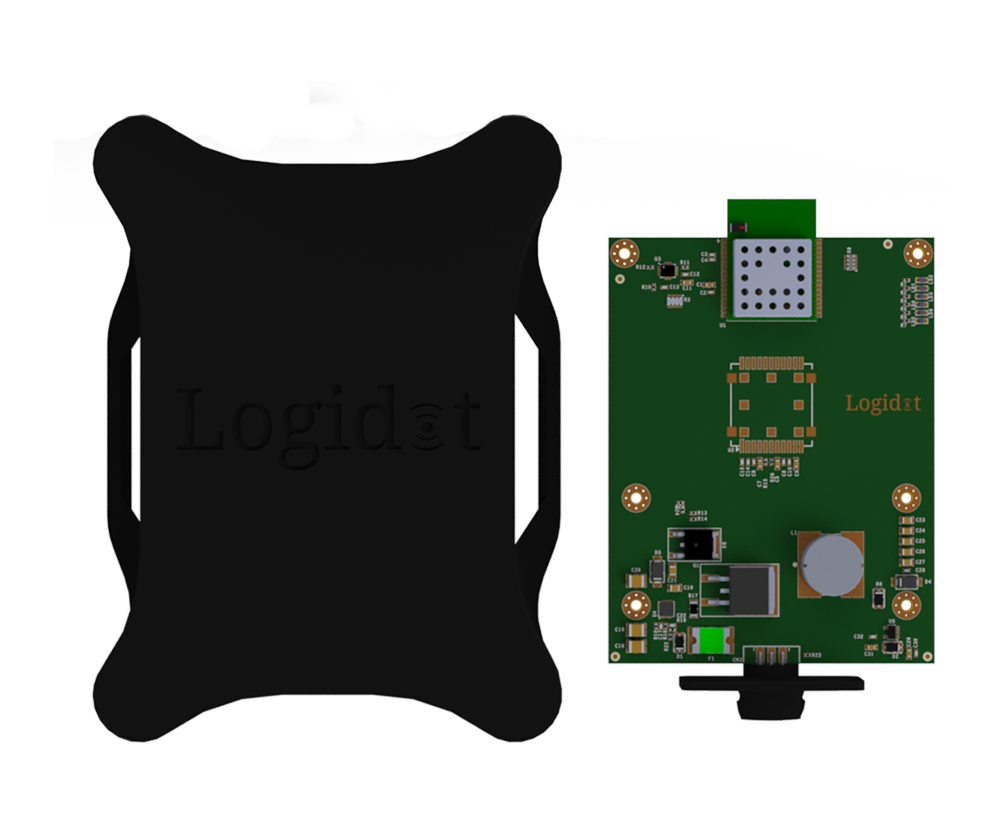
Interfaces with our gateway, integrates UWB, a 6-axis IMU (accelerometer and gyroscope) and GPS. Battery life of one week with the option to be attached directly to the vehicle power source.
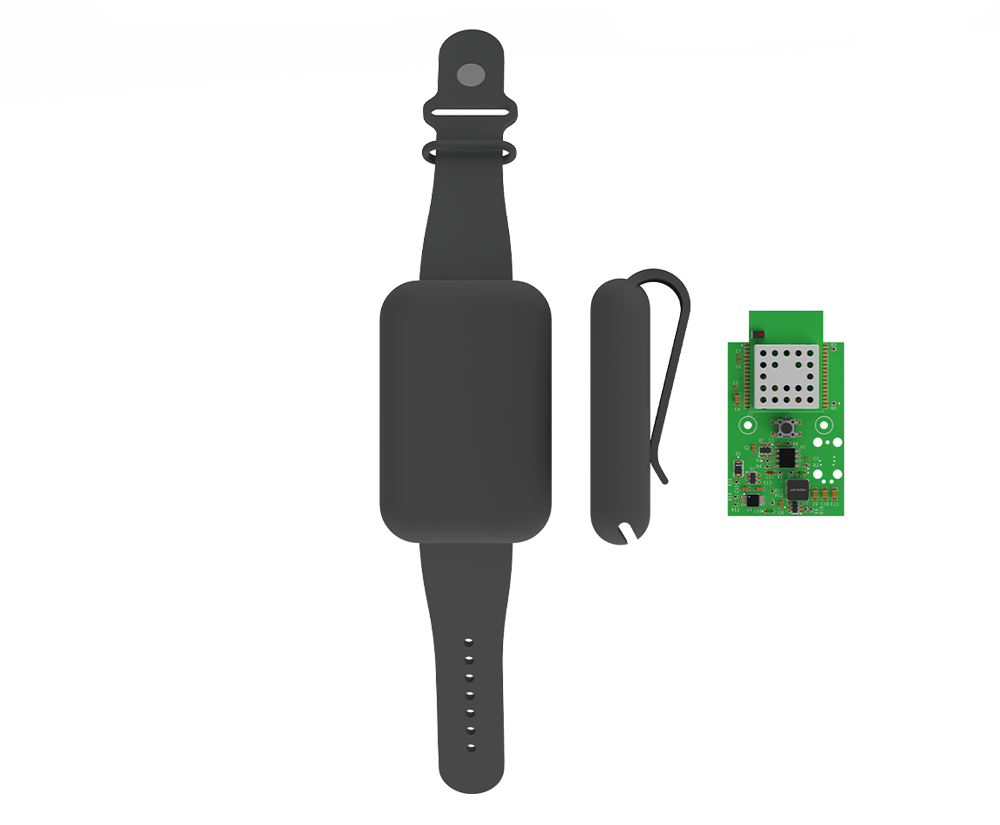
Interfaces with our gateway, integrates UWB and a 3-axis accelerometer. Battery life of one day.
The layer the other two stand on: tags on the vehicles and the people, anchors on the racking, a gateway off the floor. What they measure leaves the building once and arrives in the cloud as position, identity and status.
Data Sheet
Anchor, vehicle tag, wearable tag, and the four data sheets
Our real-time IOT platform gives location, ID, and status data for various assets and translates into measurable processes. The platform, therefore, makes it possible to monitor, optimize, and automate processes in production and logistics. The open and highly elastic architecture enables easy integration and a rapid ROI.
Anchors are the building’s reference points. Screwed, magneted or strapped to racking, columns and walls, each one ranges every tag in view over UWB — months on the internal battery, or wired into site power.
The gateway is the one box between the floor and the platform: it collects what the anchors hear and forwards it over whatever the site already has — Ethernet, Wi-Fi or a mobile connection.
A wearable tag puts the people on the floor on the same live map as the vehicles — UWB for position and a 3-axis accelerometer for what they are doing. A day on a charge, and nothing to operate.
Forklifts, pallet trucks and tugs carry a vehicle tag. UWB indoors, a 6-axis IMU for motion and GPS when the work goes outside — a week on battery, or taken straight off the vehicle’s own power.
Every position lands against your own floor plan, so the dashboard shows zones, dwell and routes rather than dots — live within seconds, analysed within minutes, and available through the API to the WMS, ERP or MES you already run.
The architecture is open at the edge too. Sensors you already have — presence, environment, gates, scanners — stream in beside Logidot’s own, so one platform carries the whole picture.
Where the work is done
Hosted for you, so there is nothing to install or keep running on site. Analytic services turn tracks into measures, the intelligence layer reads those measures against how the operation is meant to run, the reporting tools assemble what comes out, the dashboard support services serve the live view, and storage keeps the history — backed up daily and encrypted end to end.
Logidot Cloud, taken apart
The system of record you already run
The warehouse management system stays where it is. Logidot exchanges data with it in both directions — plugins for the most common providers, or an integration built for yours — so real-time position can retire the manual, error-prone steps around it instead of adding another screen.
The operation, run forward
The same data drives a model of your floor you can run forward: layouts, resource allocation, picking strategies and stock placement tried against a shift before anything moves in the building.
Positions become measures
Where tracks turn into the numbers an operation is run on: time by zone, travelled time against order fulfilment, spaghetti maps, utilisation and productivity. Analysed within five minutes of the movement itself.
Measures become judgements
What the analytics measure is read against how the operation is meant to run, so that a busy hour can be told from an unusual one and a pattern worth acting on from noise. It is what turns the numbers below it into the judgements the automation layer acts on — the three together are one pipeline, from position to insight to action.
Supervision, automated
Rules you set watch the live picture for you and flag the anomalies — a vehicle in a restricted zone, an asset that has not moved, a check that was skipped — while the reporting tool sends the regular numbers out without anyone assembling them.
What everything above stands on
The real-time location layer. UWB ranging from the anchors, motion from the tags and GPS where the work goes outdoors, fused into one position per asset against your own floor plan — 3D to 10 cm, up to 16 Hz, on screen within three seconds. Vehicles, goods, maintenance and people all arrive here first.
For the systems
Everything the platform knows is available over REST, so the systems that run the work can read it directly rather than through a person copying numbers between screens.
For the office
The live view and the reports in a browser: wherever you are, sign in and the floor is on screen as it is now, with the history behind it.
For the floor
The same platform in a hand on the floor — checks before a vehicle is used, a log of who used what and when, and the picture where the work is happening rather than back at a desk.
The RTLS platform, the four services on it, the WMS across the top and the three surfaces
Where the operation is read
What your people actually open: the web dashboard with the live map and the charts behind it, the mobile apps on the floor, and the integrations that put the same picture inside the tools they already use.
For the systems
Everything the platform knows is available over REST, so the systems that run the work can read it directly rather than through a person copying numbers between screens.
For the office
The live view and the reports in a browser: wherever you are, sign in and the floor is on screen as it is now, with the history behind it.
For the floor
The same platform in a hand on the floor — checks before a vehicle is used, a log of who used what and when, and the picture where the work is happening rather than back at a desk.
Web dashboard, mobile apps and the REST API
Your data, coming the other way
Orders, stock and master data come the other way, from the systems of record into the platform, so a position on the map is a pallet with an order behind it rather than an anonymous dot.
The system of record you already run
The warehouse management system stays where it is. Logidot exchanges data with it in both directions — plugins for the most common providers, or an integration built for yours — so real-time position can retire the manual, error-prone steps around it instead of adding another screen.
For the systems
Everything the platform knows is available over REST, so the systems that run the work can read it directly rather than through a person copying numbers between screens.
Customer data in, located goods out
Sandbox
Model an operation before a single sensor is installed. The simulator drives your own floorplan with realistic vehicle and picker movement, and the platform treats it exactly like a live site — the same map, the same alerts, the same reports you would see on day one.
Sandbox
The real one runs on your floorplan, inside the platform. This one has the same work cycle and the same dials on a sample floor — 64 by 36 metres, 280 pick faces, four zones and a fleet you control.
The floor needs JavaScript to run. The controls below describe what it does.
Click a rack bay to order that line now. Click a vehicle to follow it.
Fleet
Demand and handling
| Vehicle | Doing | Orders | km | Battery |
|---|---|---|---|---|
| No vehicles on the floor. Add one and the orders start moving. | ||||
Just happened
What this one leaves out
One floor, one shift, nearest-vehicle dispatch and simplified physics — arithmetic light enough to run at sixty frames a second in a browser tab. The production simulator plans across your own floorplan, runs shifts and rosters, and replays months of your order history.
A simulated floor: 64 by 36 metres, four zones, a fleet you control
The platform, asked in plain language
The same measures, asked for in words rather than built into a report: which aisles cost the most walking this week, why an alert fired at 04:12, what would change if the fast movers moved bay. The assistant reads what the platform already knows — live position, zone analytics, the rule events, the history — answers with the numbers it used, and hands anything it proposes to the simulator, so a change is tried against a shift before it is made on the floor. It runs beside the platform on servers we host, signed in with the same account as the dashboard.
A question, the data it was answered from, and the change tried before it is made
| Technology | Accuracy | Reach | Location | Application | Duration Anchor | Duration Tag | Infrastructure Cost | Ease of Deployment/Use |
|---|---|---|---|---|---|---|---|---|
| Wi-Fi |
 <20 m
<20 m
|
 <150 m
|
 2D
2D
|
 Medium
|
 Medium
|
Low
|

|

|
| Bluetooth (BLE) |
 <6 m
<6 m
|
 <50 m
<50 m
|
2D
|
 Medium
|
Medium
|
High
|

|

|
| RFID/NFC |
 <10 cm
|
 <1cm
<1cm
|
 Spot
Spot
|
Low
|
 Passive
|
 Low
Low
|
|
|
| Existing UWB |
 <20 cm
|
<100 m
|
 2D/3D
2D/3D
|
 Low
Low
|
High with TDoA
|
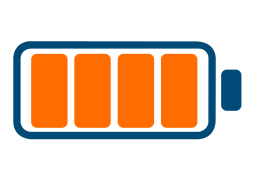 Low
Low
|
|
|
| Logidot |
<20 cm
|
<100m
|
2D/3D
|
High
|
High with TDoA
|
High
|
|
|

up to 10cm accurate in 3D and low latency
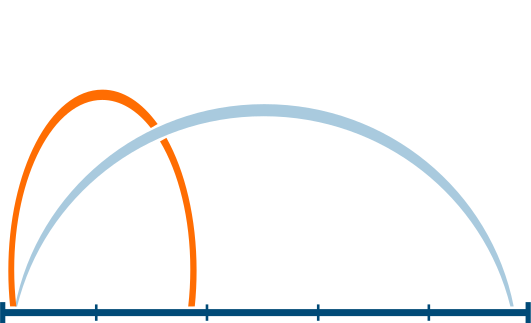
up to 16Hz

up to 50m intersensor distance

against reflections, noise, vibrations and shocks

simply add more beacons
can be deployed in a matter of minutes
Request a demo today!
Request Demo